Service weather is one of EV Observe’s differentiating assets, and a valuable “macro-supervision” tool.
SUPERVISION: WHY AND HOW?
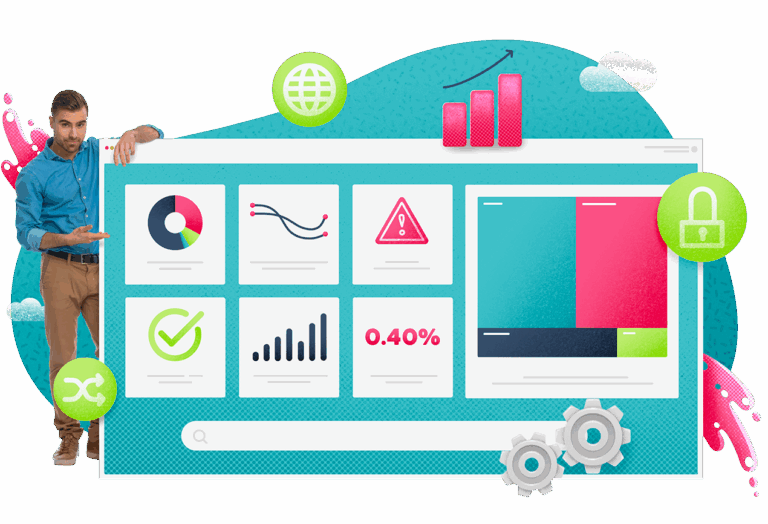
Whether you’re a user of IT applications or SaaS/Paas/Iaas services, server availability and performance are essential to your satisfaction. That’s why it’s essential to monitor all server hardware and software characteristics.
BUT ARE YOU USING IT TO ITS FULL POTENTIAL? A FEW REMINDERS
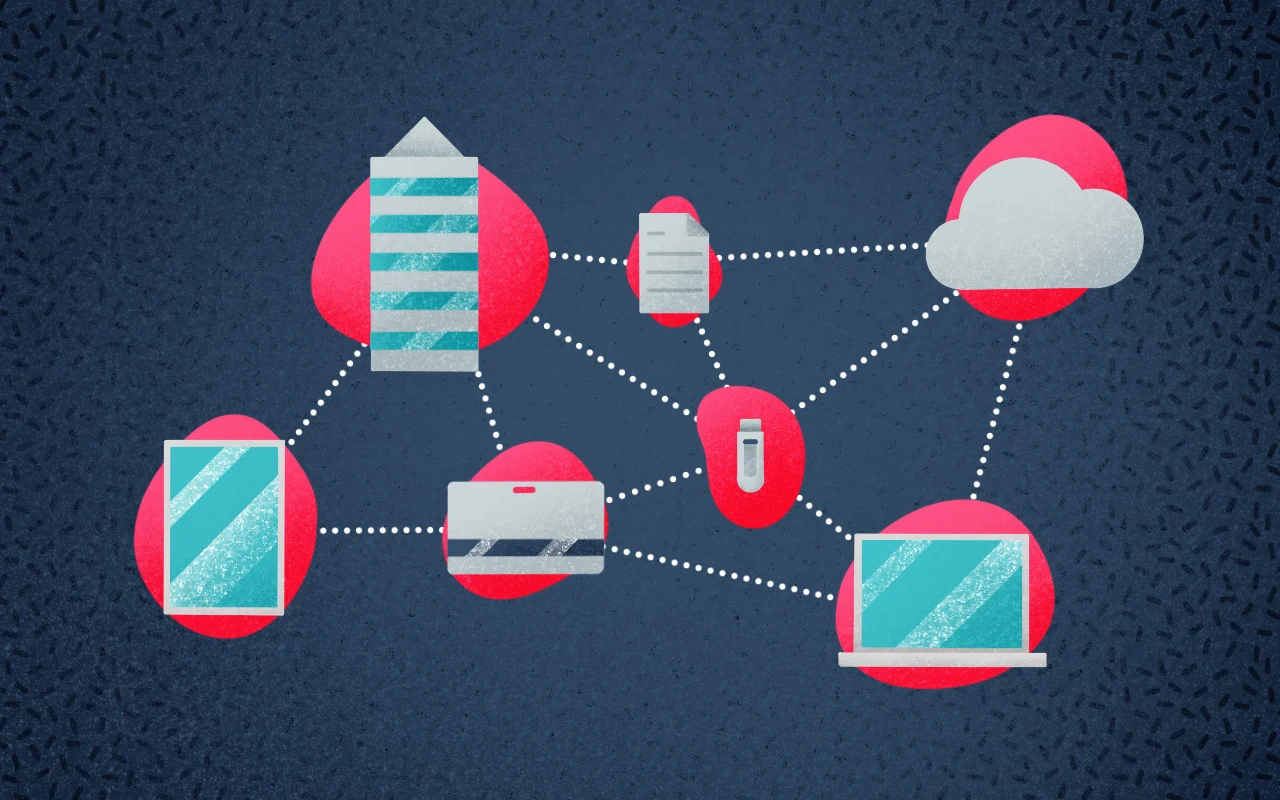
A User Service is an aggregation of one or more :
- Equipment
- Unit services
- Other user services
The service weather report (Supervision > Service weather report) presents user services in 4 states and 3 trends.
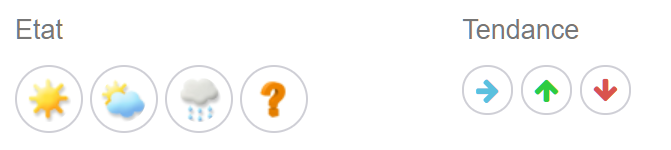
OK / degraded / out of order / unknown / constant / up / down
ASKING THE RIGHT QUESTIONS
Designing a service forecast means first of all asking the right questions:
What services does my infrastructure provide?
When are these services consumed?
Which services do I need to measure availability for, and at what rate?
Once you’ve done this, you can list all the equipment and unitary services that make up your user service, and define time slots and a target availability rate.
If the complexity is still high, it is preferable to move down the tree structure and create other services, which will make up the main service.
DEPENDENCIES
The relationships between a User Service and its various components are of the “blocking” or “degrading” type. In order to determine which type to use, here again it is beneficial to ask yourself the right questions:
If a component of my service is indispensable to its operation and cannot be redundantly linked to another component (AND relationship) -> blocking link
If a component of my service can be redundantly replaced by another component, or is not essential to the minimal operation of my service (OR relationship) -> degrading link
EXPLOIT DATA
Correctly configured weather is an asset, good reports and dashboards even more so.
A dedicated dashboard: The weather map (“Service weather map”)
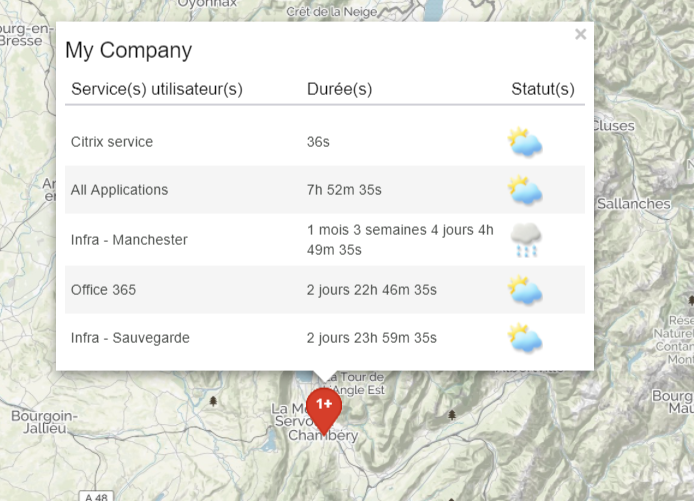
This dashboard shows the list of user departments, by site/customer, on a map background.
It is particularly relevant in a multi-site context, and also adds value in the case of technical interventions (by enabling a technician to reorganize his movements according to nearby breakdowns and their impact).
Other dashboards that integrate User Services: the “MAP fleet tracking by family”, etc.
A high value-added report: the availability report (“Availability Analysis”)
A real decision-making tool, which can be used both internally and with customers to demonstrate service quality or identify areas for improvement, the availability report enables you to consult :
- The TOP/FLOP of user services: which services are the most available over the period?
- For each User Service :
- total unavailability
- by month: changes in availability rate, number of downtimes and their duration.
- These indicators enable the IT Department to:
- communicate with customers on service availability
- identify weak points and trigger corrective action

Challenges in Monitoring of Information Systems
Unlock expert insights on IT monitoring, cost optimization and predictive analytics. Learn how supervision improves service availability, reduces downtime, and helps justify IT investments.